The Battle of Neighborhoods London vs Paris

1. Introduction

Which is better, London or Paris! Well, both cities have their unique aspects, making it hard to point out which city is better than the other in general.

Therefore, when it comes to London vs Paris, it will solely depend on what you are looking for, as well as your values. While some may prefer London, others will opt for Paris.

London and Paris are both diverse and multicultural cities and offer variety of experiences that you could ever imagine. I have tried to group the neighborhoods of London and Paris to draw insights to what you would expect and experience if you happen to be there.

And, with the below provided python program, I hope you can identify the one that best matches your preferences.

2. Business Problem

With the help of this Notebook visitor choose their destination depending on the leisure and entertainment neighborhoods have to offer. This will help tourists make decisions if they are planning to visit London or Paris. I’m sure these findings will help tourist and visitorsa make well informed decisions.

3. Data Description

To have this notebook package compile, We collected geographical location data for both cities. We collected data mainly as below:

    • Postal Codes

    • Categories

    • Neighborhoods

    • Boroughs

    • Venues and Categories.
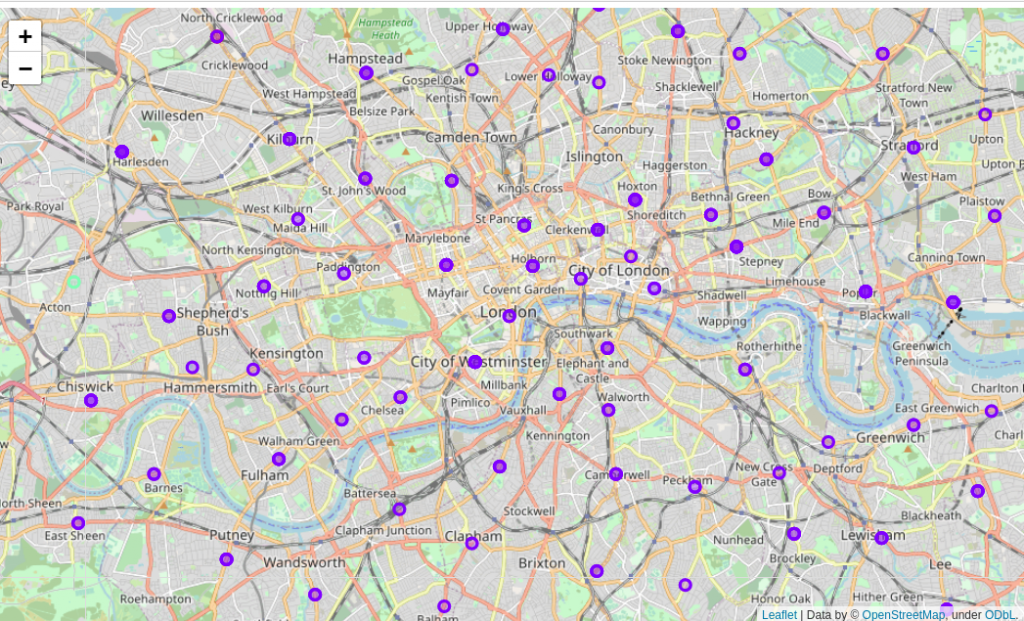
London

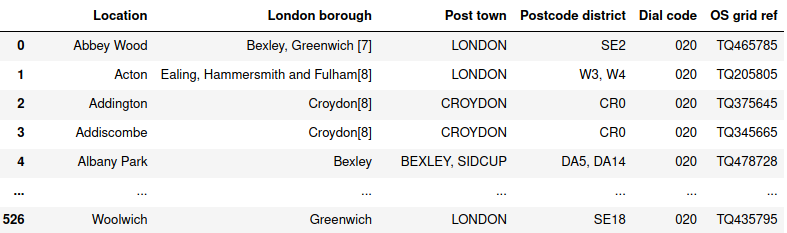
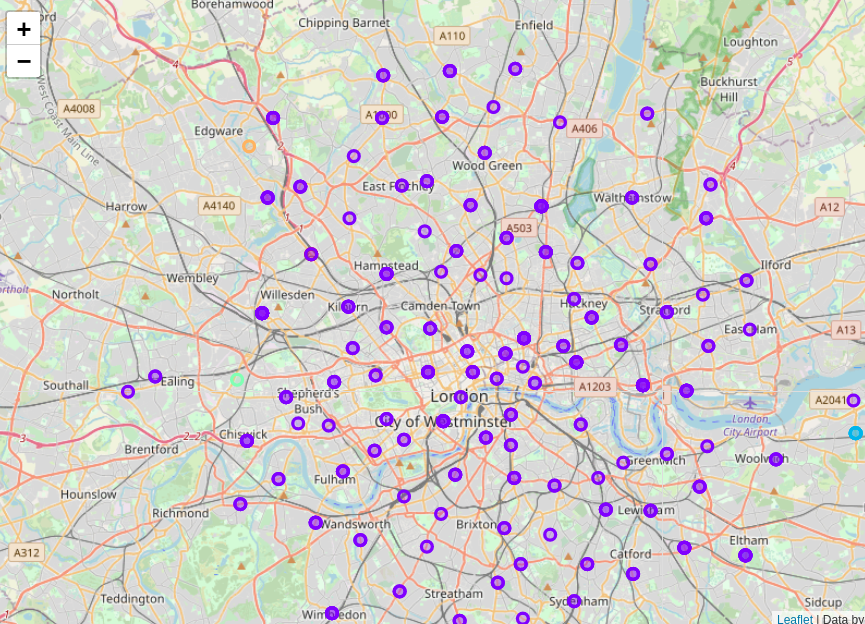
We scraped our data from https://en.wikipedia.org/wiki/List_of_areas_of_London. This wikipedia page has information about all the neighborhoods. Data we selected is Neighborhood (borough), Town (name of borough), and postal code. This wikipedia does not have geographical information so I have used Arcgis API to get geo locations of the neighborhoods i.e. latitude and longitude for London’s neighborhoods.
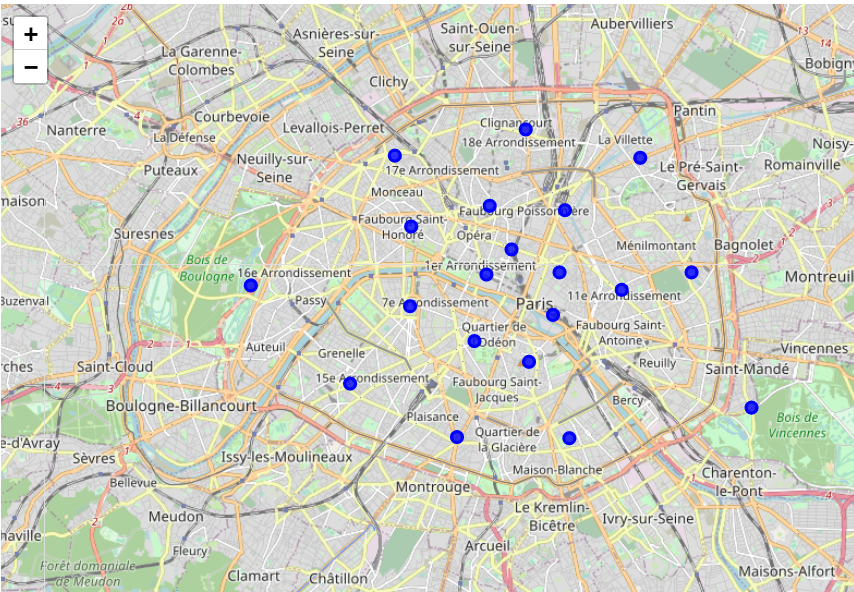
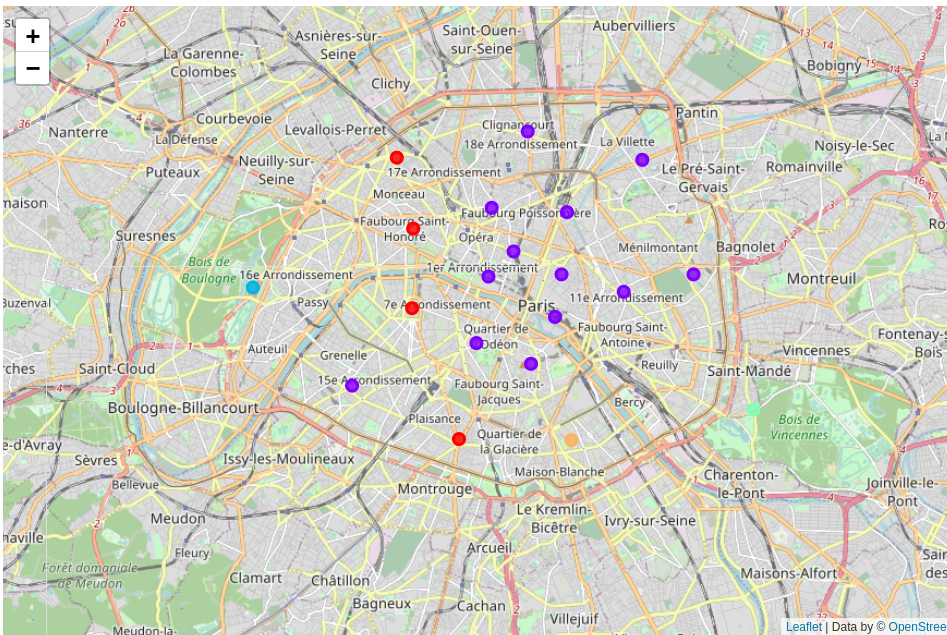
Paris

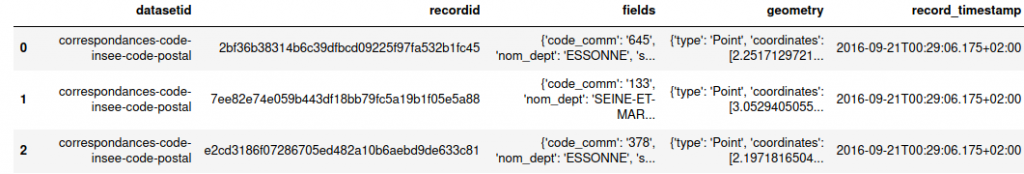
I have used JSON data that was available at https://www.data.gouv.fr/fr/datasets/r/e88c6fda-1d09-42a0-a069-606d3259114e to get the data for our solution. We only selected data for Paris and selected below noted data columns

    • postal_code : Postal codes

    • nom_comm : Name of Neighborhood

    • nom_dept : Name of the Town

    • geo_point_2d : latitude and longitude of eachNeighborhood.

Foursquare API

We used Foursquare to get data for different venues in different neighborhoods. Foursquare proides locations data related to venues and events within an area of interest. You can get venue names, locations, menus and location photos. We used foursquare location as the sole data source since all the stated information can be obtained through Foursquare API.

After compiling the list of neighborhoods, we connected through Foursquare API to get information related to venues inside each neighborhood. We limited the radius to be within 500 meters.

We retrieved below data for each venue as follows:

    • Neighborhood : Name of the Neighborhood

    • Latitude : Latitude of the Neighborhood

    • Longitude : Longitude of the Neighborhood

    • Venue : Name of the Venue

    • Venue Latitude : Latitude of Venue

    • Venue Longitude : Longitude of Venue

    • Venue Category : Category of Venue

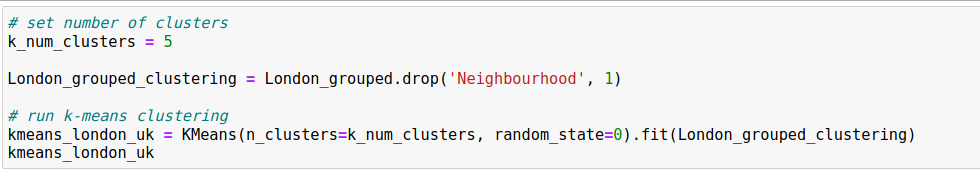
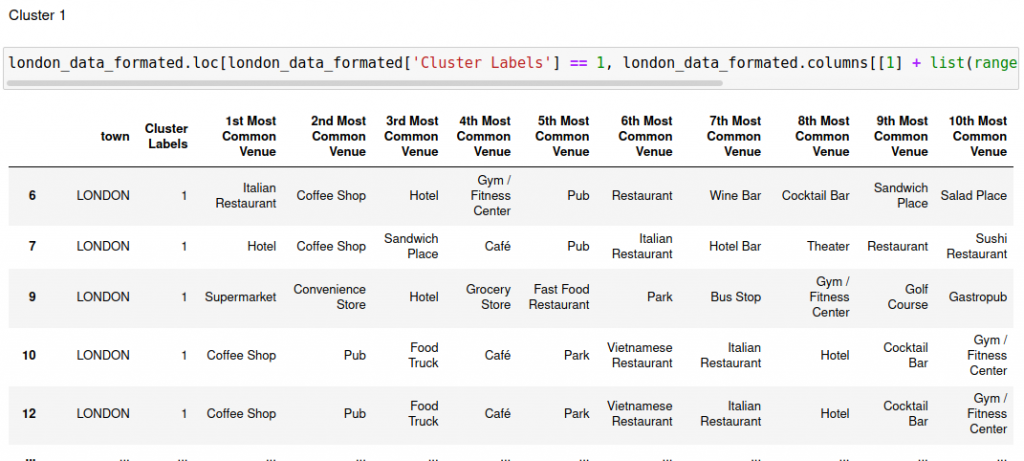
We cluster the neighborhoods based on similar venue categories and then presented observations and findings. Stakeholders should be able to take necessary decision after using this data.

4. Methodology

I have imported below noted Python Packages to create our Notebook model

  • Pandas – To collect and manipulate JSON and HTML data
  • Folium – To Generate Maps
  • matplotlib – Detailing the Maps
  • Sklearn – To import KMeans
  • Requests – Http Request
  • html5lib – to parse HTML files
  • Lambda – functions that take other functions as their arguments
  • ArcGis – mapping, geocoding, routing, and spatial analysis
  • Numpy – multi-dimensional array and matrix data structures and mathematical operations

This model provides exploration of each cities individually. Plot the map to show the neighborhoods and build the model by clustering all of the similar neighbourhoods together and finally plot the new map with the clustered neighbourhoods. We draw insights and then compare and discuss our findings.

4.1 Data Collection

In the data collection stage, we begin with collecting the required data for the cities of London and Paris. We need data that has the postal codes, neighborhoods and boroughs specific to each of the cities.

We scraped the List of areas of London wikipedia page and created a second table using the following code:

url_london_uk = “https://en.wikipedia.org/wiki/List_of_areas_of_London

wiki_london_url = requests.get(url_london_uk)

wiki_london_data = pd.read_html(wiki_london_url.text)

wiki_london_data = wiki_london_data[1]

wiki_london_data

The data looks like this:

Using JSON:

I downloaded Paris data from https://www.data.gouv.fr/fr/datasets/r/e88c6fda-1d09-42a0-a069-606d3259114e and loaded data using Pandas after reading the JSON file:

!wget -q -O 'france-data.json' https://www.data.gouv.fr/fr/datasets/r/e88c6fda-1d09-42a0-a069-606d3259114e

4.2 Data Reprocessing and preparation

London:

Formatted London data to replace the spaces and underscores in the title. The borough column has numbers within square brackets that we remove using below code:

Paris: Created a dataframe for each nested fields as below:

4.3 Feature Selection

We only needed borough, neighborhood, postal codes and geolocations (latitude and longitude) for each datasets.

London:

Paris:

4.4 Feature Engineering

Both datasets contains information for all cities in the country. We narrow down data selection and \only selected neighbourhoods that belongs to London and Paris.

London:

Paris:

I used ArcGIS API to get the latitude and longitude for London neighborhood data and used Passing postal codes to map the geographical co-ordinates. We merged source data with the geographical coordinates for further processing of data.

Map of London:

Neighbourhood map of Paris:

After we visualized each neighborhood, we needed to figure out what are the common venue and venue categories within a 500m radius. We used Foursquare to perform this task, we defined a function which collects information related to each neighborhood including venue and venue categories and limited to 100.

4.5 One Hot Encoding

I used One Hot Encoding to work with categorical datatype of each venue categories. This helps to convert the categorical data into numeric data. I performed one hot encoding and then calculated the mean of the grouped venue categories for each of the neighborhood.

4.6 Top Venues in the Neighbourhoods

We needed to rank and label the top venue categories in our neighborhood.

Define a function to get the top venue categories in the neighborhood.

There are many categories, we will consider top 10 categories to avoid data skew.


create a new dataframe for London:

4.7 Model Building with KMeans

I used KMeans algorithm to cluster similar neighborhoods together and we have five number of clusterss.

We then join London_merged with our neighborhood venues sorted to add latitude & longitude for each of the neighborhood to prepare it for visualization.

4.8 Visualizing the clustered Neighbourhoods

I used Folium to drop all NaN values to prevent data skew

london_data_nonan = london_data.dropna(subset=[‘Cluster Labels’])

Map of clustered neighbourhoods of London:

Map of clustered neighborhoods of London

Map of Clustered Neighborhoods of Paris

4.9 Examining our Clusters

5. Results and Discussion

The neighborhoods of London and Paris are very multicultural. There are lots eat-in places including Chinese, Italian, Indian and Turkish. In London public transport is pretty good and there are lots of bars, coffee shops, Fish and Chips shop and Flea Markets. Paris is little small but there are lots variety of cuisines including French, Thai, Asian, Chinese and Pakistanis. Public transport in Paris is different IE. buses, boats and ferries. There are lots of shopping, Parks, Art galleries and Museums and Historic sites. Overall, Paris seems like a better vacation spot with a mix of possibilities.

6. Conclusion

The purpose of this project was to explore the cities of London and Paris and see how attractive it is to potential tourists and migrants. We explored both the cities based on their postal codes and then extrapolated the common venues present in each of the neighbourhoods finally concluding with clustering similar neighbourhoods together.

We could see that each of the neighbourhoods in both the cities have a wide variety of experiences to offer which is unique in it’s own way. The cultural diversity is quite evident which also gives the feeling of a sense of inclusion.

Both Paris and London seem to offer a vacation stay or a romantic getaway with a lot of places to explore, beautiful landscapes, amazing food and a wide variety of culture. Overall, it’s upto the stakeholders to decide which experience they would prefer more and which would more to their liking.

Link to my Notebook: https://github.com/shahidmian1/IBM-Data-Science/blob/main/week5-capstone-final.ipynb